

Amazon Scraper API vs Proxy: Choose a Product Data Source
Distinguish authorized Amazon APIs, licensed product data and proxy-based page checks by record quality and access rights.
Read guide
Monitoring residential proxies at scale starts with treating “proxy uptime” as three separate signals: gateway connectivity, target-site success, and…

Monitoring residential proxies at scale starts with treating “proxy uptime” as three separate signals: gateway connectivity, target-site success, and sticky-session continuity. If you track all three — plus latency and error patterns like 403, 429, and timeouts — you can build dashboards that show real reliability for scraping and AI workloads, not just raw bandwidth.
This guide explains how to measure residential proxy uptime, success rates, and error profiles, and how ProxyLane’s reliability infrastructure fits into that picture.
For residential proxies, uptime is not a single number. Proxy uptime is the combination of:
Most providers only advertise network uptime. To actually protect scraping and AI workloads, you need metrics and checks for all three layers.
ProxyLane’s residential proxy network is designed around verifiable reliability, not only pool size:
Instead of a generic SLA, the platform encourages users to test proxies directly in the dashboard, verify exit IP, and confirm target-site behavior before scaling. That verify-first workflow is exactly what your monitoring should codify.
To measure residential proxy uptime, focus on black-box monitoring: observe what your scraper or AI agent experiences end-to-end. Then break those signals into metrics that you can aggregate over time.
At minimum, define:
Proxy connection success rate
successful proxy handshakes / total connection attemptsTarget success rate
requests that return acceptable target output / total requestsSession continuity rate
sticky-session requests that retain the intended exit IP over the required step window / total sticky-session requestsThese metrics should be calculated per:
Many providers advertise uptime (99.9%+), but for data teams success rate matters more.
These numbers are useful benchmarks. But your own target success rate — measured on your actual sites, queries, and geos — is what should drive operational decisions.
Once uptime is measured, the next step is understanding why requests fail. HTTP status codes and timeouts give strong signals about proxy health vs target-side defenses.
Track error patterns with explicit metrics:
Block rate
(403s + explicit block pages + other denial responses) / total requestsRate-limit rate
429s / total requestsAuth / config failure rate
407s / total requestsTransport failure rate
(timeouts + 502 + 503 + 504) / total requestsRetry amplification
total attempts / successful outputsFor large scraping and AI workloads, raw request volume can hide problems. Error patterns reveal whether issues are:
Bright Data explicitly describes rising response time or error rate as the main signs of an incident. If you treat those as primary signals, you can alert on symptoms instead of trying to predict every possible cause.
Latency is the other half of proxy reliability. A technically “up” proxy that suddenly takes seconds to respond can still break SLAs and workflows.
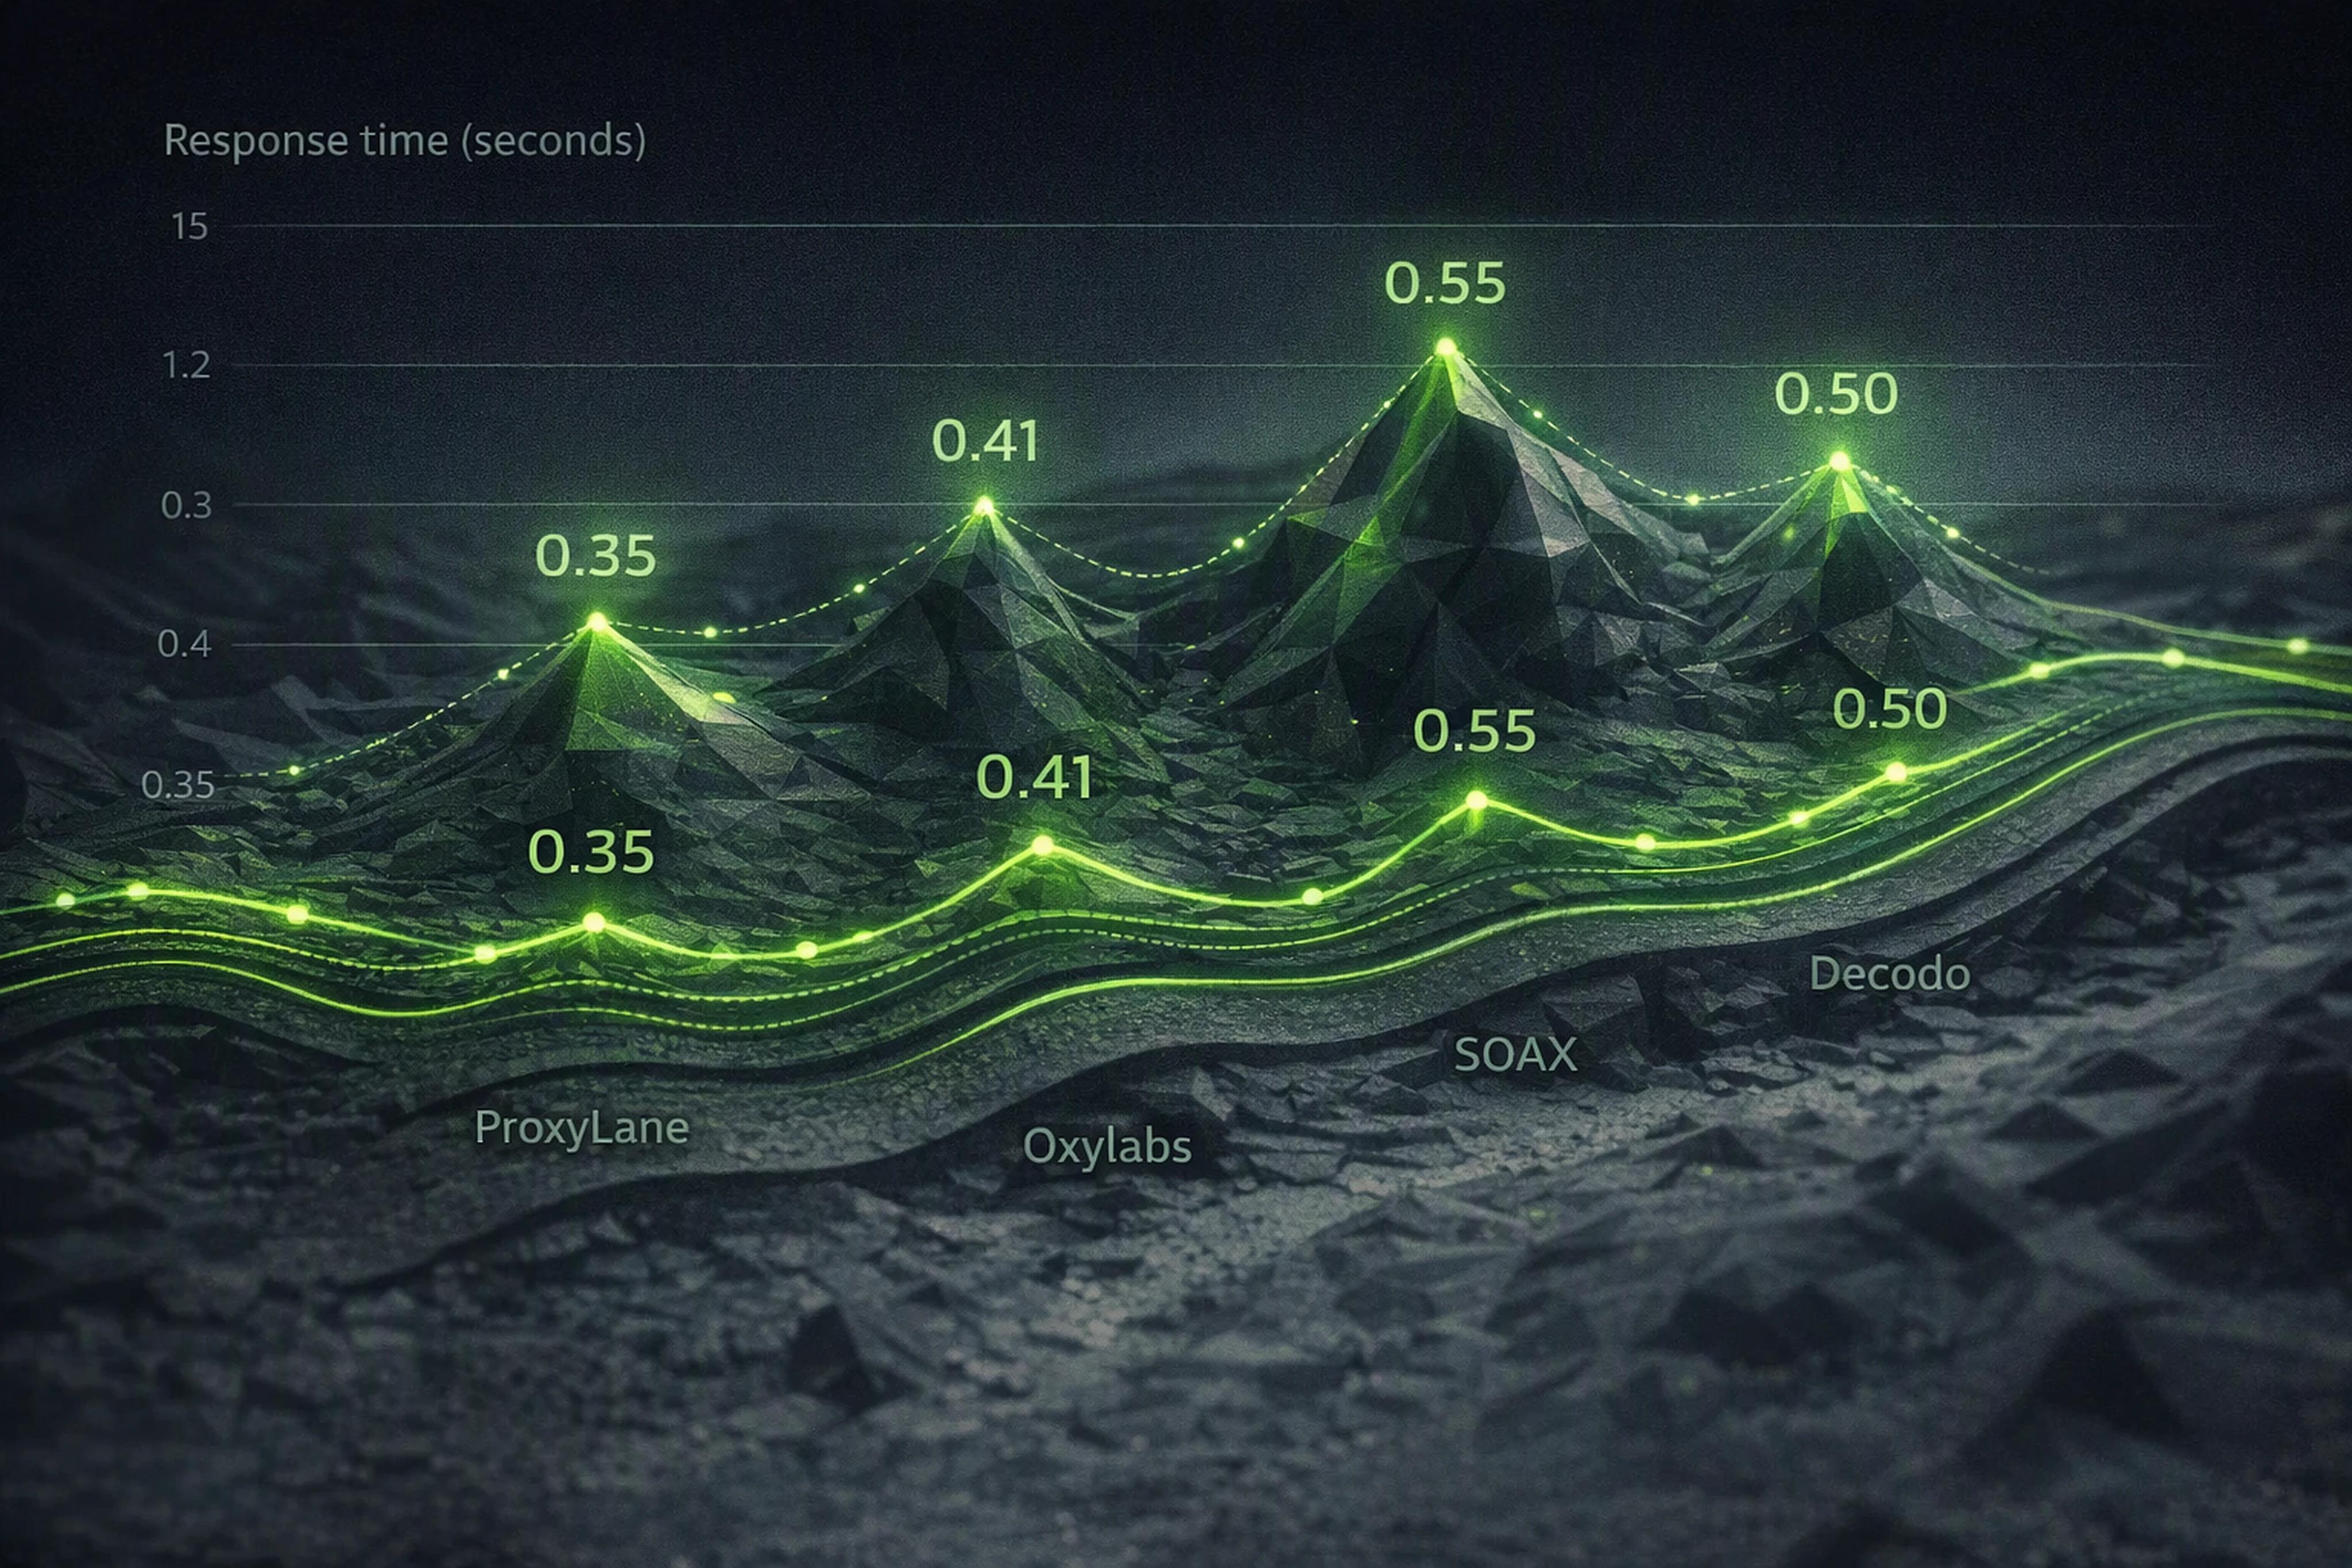
Residential proxies add latency compared to datacenter proxies. SOAX’s latency guide notes typical additions of 100–800ms due to:
Against that backdrop:
For each provider, geo, and key target, track:
Latency spikes combined with rising transport failures (timeouts, 502/504) are a strong signal to slow or pause workloads until the proxy provider recovers.
Proxy pool “health” isn’t just about how many IPs you have. It’s about how often the IPs behave as expected and match the locations you requested.
For localized testing, pricing intelligence, or lead qualification, geo misalignment can invalidate results. Track:
verified exits matching requested country/city/ISP/ASN / total verified exitsImplement it by:
Residential pools are dynamic. Devices go offline, ISPs change, and sessions must adapt. Monitor:
ProxyLane’s guidance that sticky sessions are “sticky while the device stays online” reflects this reality. Session continuity monitoring lets you detect when device churn starts affecting multi-step workflows.
To keep proxy performance visible, follow observability patterns used for production systems. Grafana popularized RED (Rate, Errors, Duration) for user-facing metrics, and USE (Utilization, Saturation, Errors) for resource health.
For user-facing data pipelines (scrapers, AI retrieval):
A proxy monitoring dashboard that follows RED might include panels for:
For proxy gateways and internal infrastructure:
Google SRE and Prometheus emphasize black-box monitoring and alerting on symptoms, not causes. For proxies, that means alerting when target success rate or session continuity drops, instead of guessing about internal gateway states.
Residential proxies at scale rely on automated rotation and intelligent retries. Monitoring has to include the behavior of the rotation layer itself.
Capture metrics on:
Best practices include:
Feed monitored metrics into your rotation logic:
The reliability problem is getting bigger because automation now accounts for most web traffic. Imperva’s reports show:
As more providers and sites respond, residential proxy networks have to be more transparent and measurable. That’s why leading vendors now expose:
ProxyLane’s focus on non-expiring traffic, granular geo/ISP targeting, and developer-first integration fits into this trend: treating proxies as critical infrastructure with monitorable behavior, not just bandwidth. Teams can plug ProxyLane’s HTTP/SOCKS5 endpoints into standard tools (Python, Playwright, cURL, n8n) and apply the metrics in this guide without proprietary SDKs.
For concrete workflow examples and buying guides built around cost per successful result, see the use-case content at proxylane.dev.
Measure uptime as proxy connection success rate and target success rate rather than a single provider SLA. Log each attempt to connect to the proxy gateway, plus the full HTTP response from the target site, and aggregate per hour, per domain, and per geo.
Rotation frequency depends on the target, but a common pattern is:
For AI retrieval and enrichment pipelines, prioritize:
Start with a RED-style dashboard:
 ProxyLaneTraffic never expires
Scale your workflows with the tools you already use. Rotating or sticky sessions up to 72 hours.
Distinguish authorized Amazon APIs, licensed product data and proxy-based page checks by record quality and access rights.
Read guideChoose the right anti-detect browser proxy guide, map the shared verification steps, and keep account access separate from the network route.
Read guideSeparate Australian egress from en-AU content, AUD pricing, GST display, postcode validation and the state delivery context.
Read guide